Questions? Please give us a call:
1 (877) 355-3225
Questions? Please give us a call:
1 (877) 355-3225
2018 Results
Fluke Calibration sponsored and created this survey. Invitations were circulated via email and on social media. The survey included 17 questions about respondents’ geographic location; type of organization, industry, and lab; gender; job title; education and years of experience; salary; and workload. Salary estimates listed below are based on median values by volume of pay ranges selected.
By comparing this year’s results with prior-year data, interesting changes can be noted. This year we saw more females in our sample, growing 5 points to represent 11% of all respondents in 2018. While last year females tended to be newer to the industry, this year we saw more even diversity between years of service for females.
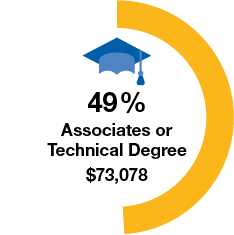
Last year we neglected to include Associates or Technical Degree in our education mix, which proved to be an important distinction in 2018 results. This year 49% of respondents reported this degree type as their highest education level.
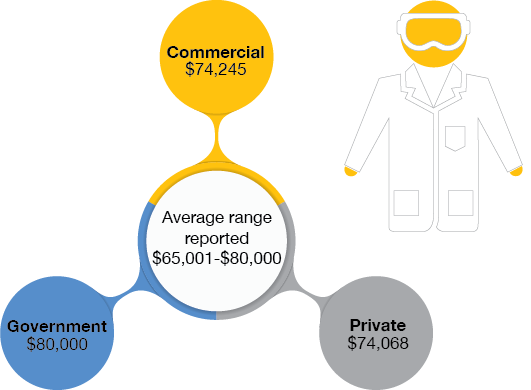
Average reported yearly pay is showing signs of potential growth. Prior-year mode response centralized in the “Less than $50,000” category. This year the most-reported bracket was “$65,001 – $80,000.”
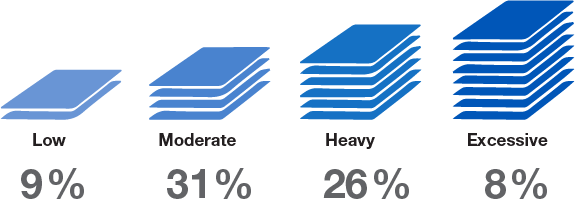
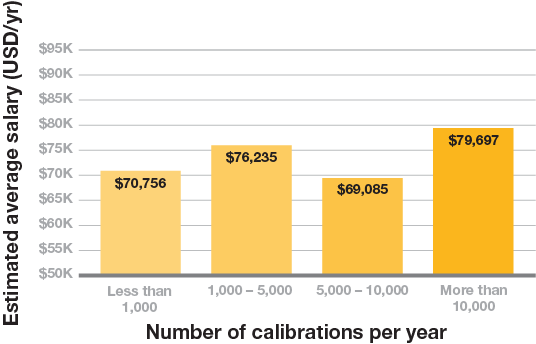
Number of calibrations per year also shows signs of year-over-year growth. Last year 22% of our sample reported performing less than 1,000 calibrations per year. This year that number shrank to 9%, while our “5,000 – 10,000” category grew 8 points to 26% and “more than 10,000” category increased 4 points to 34% (now our most-reported category).
Last year, the highest-paid industries reported were “Process Industries (not oil and gas),” “Electrical Power Generation, Transportation and Distribution,” and “Pharmaceutical.” This year, employees from the “Electrical Power Generation” and “Transportation and Distribution” industries reported salaries 13% higher than previously reported. “Process Industries (not oil and gas)” salaries appeared to be flat year-over-year, while “Other Healthcare” and “Defense Contractor” industries emerged as among the higher-paid industries this year.
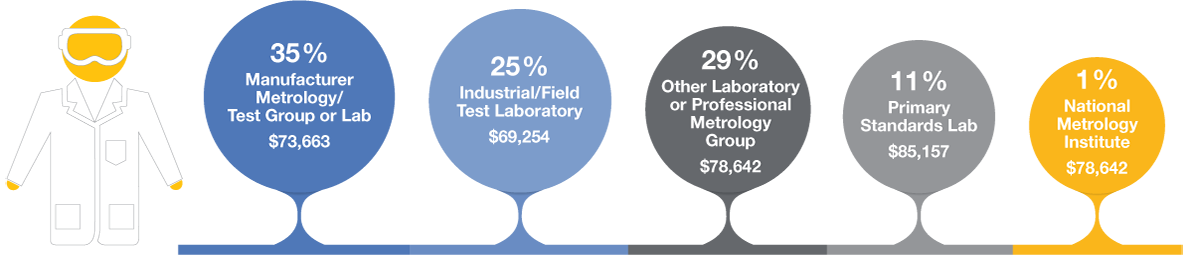
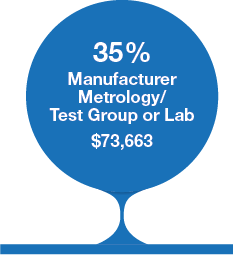
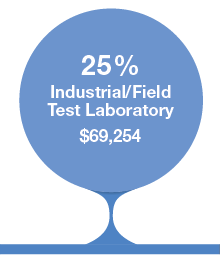
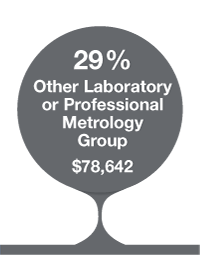
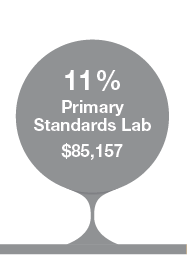
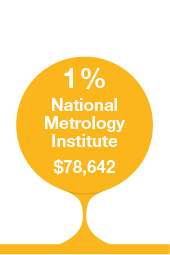
Median pay ranges were similar across all lab types, but Government labs in our sample appear to indicate year-over-year growth in median pay ranges and now reportedly offer the highest average salaries of the three.
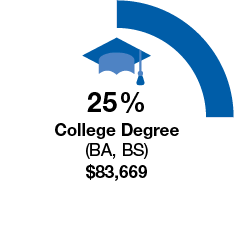
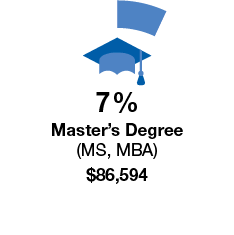
Respondent mix for educational background is likely more accurate this year with the addition of the “Associates or Technical Degree” category. Almost half of this year’s respondents reported holding a technical degree. While the salary benefit of a bachelor’s degree seemed clear in our sample, increases from an advanced degree appeared more slight in reported numbers.
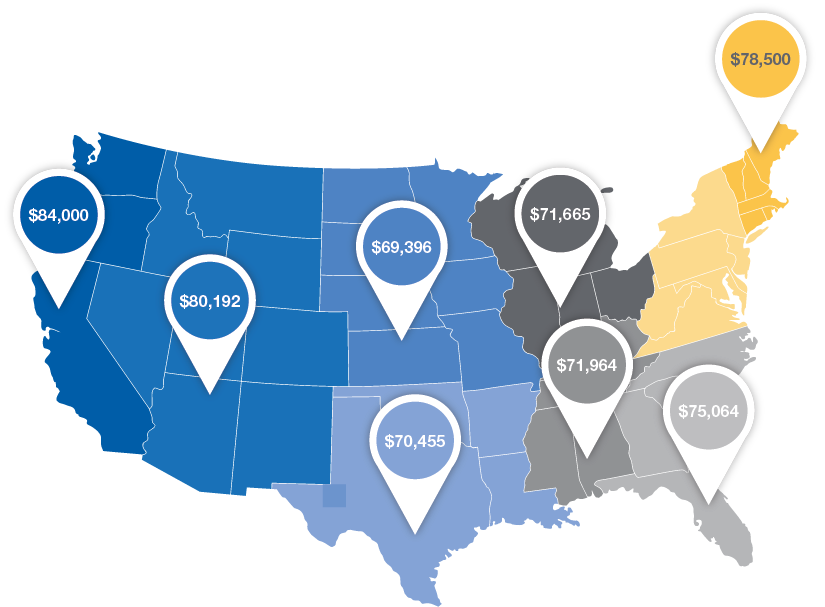
Pay averages across regions generally fell between the $65,001 and $95,000 range. Regions with noticeable year-over-year (YOY) growth in estimated average pay were East South Central (+9% YOY) and West South Central (+6% YOY).
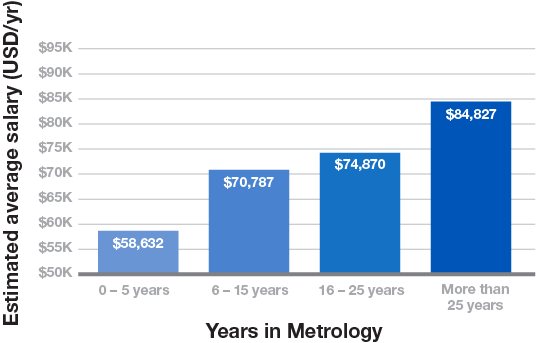
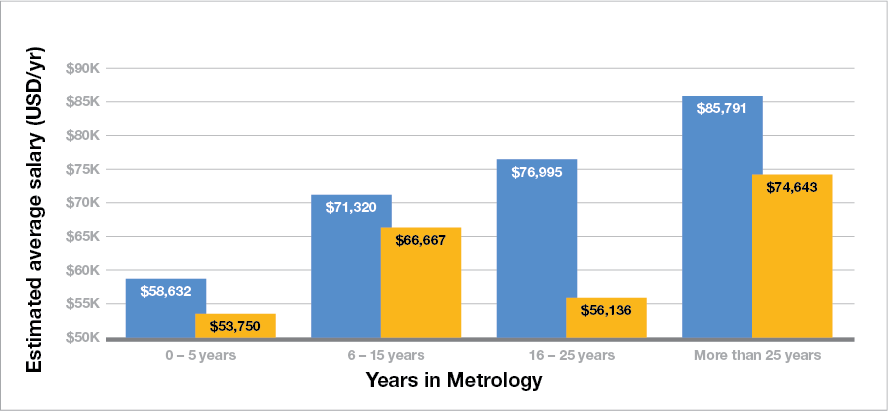
Predictably, the more years service in calibration/metrology the higher compensation we see. Interestingly, only the "More than 25 Years" category showed year-over-year growth in estimated average salary numbers, with 3% increase over last year's sample; 0–5 Year salaries appear to have decreased slightly, and the other two categories are approximately flat.
Year-over-year comparison shows no apparent correlation between number of calibrations performed per year and reported salary averages, with the exception of those labs performing more than 10,000 calibrations/year (which showed indications of paying higher salaries than other groups for both years.)
Our 2016 survey indicated a possible pay disparity, potentially related to years of service, between men and women in our sample--with women reporting approximately 25% less average pay. This year's sample indicated evidence of disparity remains (women average of 15% less average pay than men), and with more women in our sample we do not see indications this relates to years of service. Government lab types in our sample were an apparent counterexample, with women reportedly earning approximately 10% more than men in that sector.
Most other data comparisons in our sample did indicate women’s salaries are lower than men, with the biggest gaps for women with a high school diploma (only), and those working in the South Atlantic and East North Central regions; gap analysis by job title was limited by sample sizes for each, but the biggest gender-pay disparity among job titles appeared to be for Department Managers.

| Job role | Average range reported | Estimated average salary (USD/yr) |
|---|---|---|
| Calibration engineer | $80,001 – $95,000 | $81,919 |
| Calibration technician | $50,000 – $65,000 | $64,367 |
| Department manager | $80,001 – $95,000 | $94,110 |
| Engineer other | $80,001 – $95,000 | $93,750 |
| Executive management | $95,001 – $110,000 | $107,853 |
| Metrologist | $65,001 – $80,000 | $76,466 |
| Other not listed | $50,001 – $65,000 | $62,528 |
| Sales/Marketing | $80,001 – $95,000 | $87,500 |
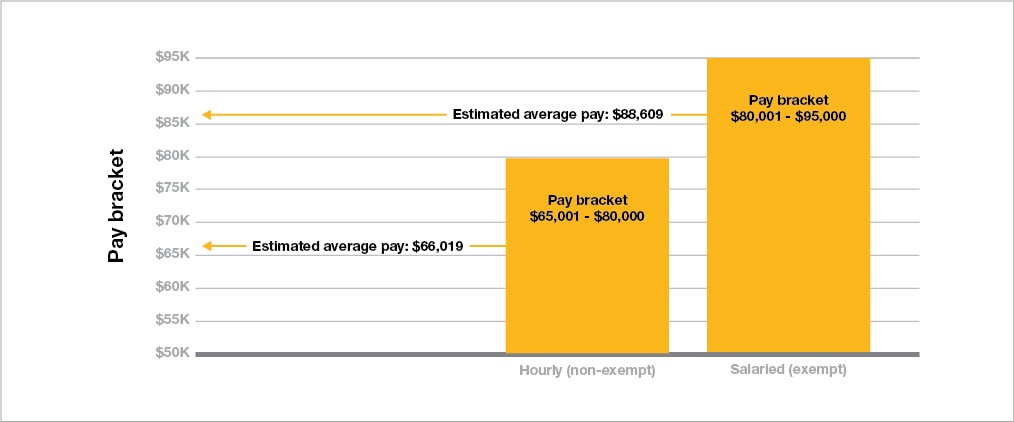
This year we introduced a question to determine if there is a salary benefit to being a salaried employee as opposed to hourly. Our sample showed clear indication of such benefit. While over half (60%) of those who completed the survey were hourly, salaried employees reported an average of 34% higher pay.
Average range reported
$85,001 – $95,000
Defense Contractor
$85,172
Electrical power generation,
transportation and distribution
$93,929
Other Healthcare
$90,500
Process Industries (not oil and gas)
$85,000
Average range reported
$65,001 – $80,000
Distributors/Procurement
$57,500
Independent testing labs
$57,500
Oil and Gas
$60,500
Other manufacturing
$66,406
Most respondents reported workloads are heavy but not excessive.